
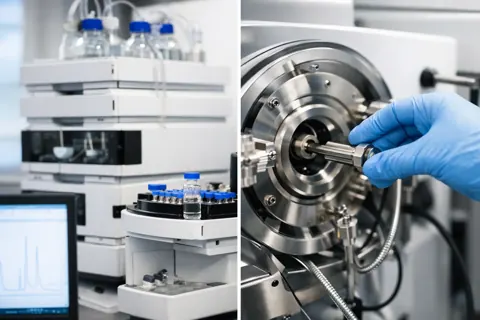
A chromatogram dominated by one peak and a mass spectrum consistent with the expected peptide provide different kinds of reassurance. The first describes separation and relative detector response. The second supplies molecular-mass evidence. Neither result should be stretched into a conclusion it cannot support.
Rather than choosing HPLC or mass spectrometry as the better test, researchers should begin with the analytical question. Is the concern a mixture of impurities, an uncertain identity or a change between batches? The answer determines which evidence matters most and when complementary methods are needed.
These distinctions apply to laboratory research materials only. Neither technique establishes suitability for human consumption.
Begin with separation versus molecular measurement
High-performance liquid chromatography, usually abbreviated to HPLC, passes a sample through a column under pressure. Components interact differently with the stationary phase and mobile phase, so they may emerge at different times. A detector records their signals as chromatographic peaks.
Mass spectrometry, or MS, measures the mass-to-charge ratios of ions. With appropriate interpretation, those signals support determination of molecular mass and comparison with the expected compound.
The techniques therefore operate on different principles. HPLC is primarily a separation technique; MS provides mass-based information. They can also be coupled, allowing chromatographically separated components to be examined by mass spectrometry rather than treating the two analyses as unrelated documents.
That distinction is the foundation for reading a peptide certificate accurately. A purity figure and an observed mass do not duplicate each other: they address separate parts of the characterisation.
What an HPLC purity result supports
In common peptide reporting, chromatographic purity is calculated from the integrated area of the assigned main peak relative to the total included peak area. If the reported result is 99%, the main peak accounts for approximately 99% of that integrated response under the method used.
This can help reveal synthesis by-products, shortened sequences and degradation products when they separate and are detected. It also provides a basis for comparing batches analysed using suitably comparable methods.
However, area percentage is not automatically a measurement of peptide content by weight. Different components may produce different detector responses, and some constituents may not be adequately detected at all.
The wording of the result matters. “99% by HPLC area” is a specific analytical statement. “The vial contains 99% intended peptide” is a broader claim requiring evidence that the chromatographic figure alone does not supply.
Why separation quality changes the interpretation
A chromatogram is shaped by the analytical conditions. Column chemistry, mobile-phase composition, gradient and detector settings influence the peaks that appear and how well they separate.
Two components may co-elute, contributing to the same apparent peak. A high main-peak area can therefore conceal complexity if the method does not resolve the relevant impurities. Conversely, multiple peaks do not identify the substances responsible without further investigation.
This is why a visually clean trace should not be treated as self-validating. Review the method and integration alongside the image. Where a particular impurity is important to the research question, the method must be capable of detecting or separating it adequately.
HPLC is highly useful for profiling a preparation, but its strength depends on the suitability of the method, not merely on the presence of a chromatogram.
What mass spectrometry adds
MS helps answer whether an observed component has a molecular mass consistent with the intended peptide. The report should allow the expected and measured results to be compared meaningfully, taking account of how the spectrum was interpreted.
An appropriate mass match strengthens identity evidence. It is especially useful when a sample looks homogeneous by chromatography but the assignment of the main component remains uncertain.
Depending on the instrument and analysis, MS can also investigate low-level components or provide fragmentation information relevant to structural characterisation. Those capabilities should not be assumed from a certificate that merely lists “MS” without showing what was measured.
Intact mass alone has limits. Compounds can share a molecular mass while differing structurally, so matching the expected value does not necessarily prove the complete sequence or distinguish every related form. The required depth of identification depends on the material and the research application.
Why finding the correct mass is not a purity assay
A sample can contain the intended peptide and additional compounds at the same time. Detecting the expected mass establishes useful evidence of its presence, but does not show that other constituents are absent.
MS signal intensities are also influenced by ionisation and instrument conditions. A prominent signal should not automatically be interpreted as the same proportion of the sample by weight, or as an HPLC-style purity percentage.
This is the mirror image of the HPLC limitation. Chromatographic dominance does not independently prove identity; an expected mass does not independently establish overall purity.
Reading the methods together helps avoid both errors. The objective is not to accumulate acronyms on a certificate, but to obtain evidence that addresses the relevant uncertainties.
Apply the distinction to peptide impurities
Peptide synthesis and subsequent handling can produce closely related materials, including deletion sequences, incomplete chain assemblies and oxidation products. Some may separate readily under a suitable HPLC method. Others may require different conditions or additional investigation.
Mass information can help interpret separated components and support assignment of the intended peptide. Fragmentation analysis may provide further structural insight where needed, although not every routine report includes it.
A useful analytical framework therefore asks two linked questions: what components can the method distinguish, and what evidence identifies those components? A percentage without an assignment and an assignment without an impurity profile each leave part of the picture unresolved.
Neither technique automatically covers every other quality attribute. Water content, counterions, residual solvents and endotoxin may require separate assessments where relevant to the laboratory’s work.
Choose the report that answers the immediate question
If the concern is whether two batches have comparable detected impurity profiles, their HPLC results are a sensible starting point. Meaningful comparison requires attention to method differences, rather than ranking the headline percentages alone.
If the concern is whether the principal component is consistent with the intended peptide, mass evidence becomes central. A chromatographic retention time can support an assessment in context, but is not a unique molecular identifier.
If an unexpected peak or mass appears, neither a favourable summary percentage nor a familiar product name resolves the discrepancy. The laboratory may need to investigate the signal and determine whether additional characterisation is necessary.
This question-led approach is more useful than deciding that one technique is universally superior.
Read the COA as a connected record
Check that the certificate identifies the product, batch, testing date and laboratory. Then establish whether the HPLC and MS results refer to the same relevant sample or batch and whether the supporting output is available.
For chromatography, look for method details, the chromatogram and the basis of the reported area percentage. For MS, look for the expected mass, observed result and enough context to understand the comparison.
Unmatched batch references or unexplained differences between documents weaken the interpretation. Resolve those issues before relying on the results for a procurement decision. For international orders, clear records are particularly useful because the material may be assessed remotely before receipt.
Product and delivery references
Researchers considering MOTS-c can begin with the MOTS-c product reference and request the analytical documentation relevant to the available batch.
The Coín delivery information explains ordering context for that destination. Delivery is from Germany, the USA or China, in 5–18 business days from tracking, rather than from local premises in Coín.
For further information about independent analytical evidence, see the third-party testing overview. Independence adds context, but the report still needs appropriate methods and traceable sample identification.
A complementary interpretation
HPLC is useful for separating components and estimating chromatographic purity. MS supplies molecular-mass evidence that supports identity. Their combined value comes from addressing different uncertainties, not from turning two limited tests into an absolute guarantee.
A careful conclusion states what each result demonstrates, what remains unresolved and whether the evidence meets the needs of the intended laboratory work. That is a stronger standard than accepting either a high percentage or a matching mass in isolation.
Peptides in this article
Add a solvent
- Bacteriostatic Water
Kit of 10 × 10 ml vials · Standard solvent for most peptides
€149.00 - Acetic Acid Kit
Kit of 10 × 3 ml vials (liquid) · For peptides that stay cloudy in BAC water
€149.00
Share Regena with a research colleague. They get trusted peptides; you earn 3–30% affiliate commission based on your monthly referred sales.
More research reading
Not sure which peptide fits your research question?
Take the 60-second Find Your Peptides quiz — it points you to the most relevant reference compounds for your area of investigation.
Start the quiz