
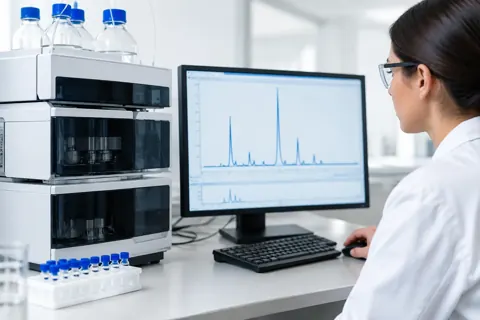
An extra peak on a peptide chromatogram can reveal a non-target component. The absence of extra peaks is harder to interpret: an impurity may be absent, below the method’s detection capability, or hidden within another signal. This is the central distinction when asking whether HPLC detects impurities.
High-performance liquid chromatography can reveal many peptide-related impurities and provide a useful record for comparing batches. Its effectiveness depends on two things working together: separation in the column and detection after the components leave it. Understanding both helps researchers avoid reading more certainty into a certificate than the data supports.
How an impurity becomes a visible peak
During an HPLC analysis, a solvent system carries the prepared sample through a column. Components interact differently with the stationary material and therefore emerge at different retention times. The detector records their passage as signals plotted against time.
Reversed-phase HPLC is common in peptide work, with separation often influenced by differences in hydrophobicity. Truncated peptides, deletion sequences, oxidised forms, synthetic by-products and degradation products may elute before or after the intended peptide. When separation is adequate and the detector responds sufficiently, these components appear as distinct peaks.
However, a peak does not identify itself. Its presence shows a detected component under the chosen conditions, but establishing what it represents may require further investigation. A minor peak should not automatically be assigned to a particular degradation product solely from its position on the trace.
The same caution applies to the main peak. Its dominance can support a chromatographic purity assessment, but does not independently confirm that it is the claimed peptide.
What the area calculation includes—and excludes
Many certificates express purity as the main peak’s percentage of the total integrated peak area. This describes how the recorded signal is distributed among the peaks included in the calculation. It does not necessarily describe the proportions of all substances by mass.
Crucially, the remainder of an area-percentage calculation represents other integrated signals. It is not a separate allowance for substances the method failed to detect or resolve. An impurity hidden within the principal peak may instead contribute to that peak’s area, making the result appear simpler than the underlying mixture.
Different components can also produce different detector responses. Relative peak areas are therefore most informative when interpreted within the method’s assumptions and limitations. They should not be treated as a universal inventory of everything present in the sample.
Where HPLC can miss non-target material
Co-elution occurs when two or more components leave the column at nearly the same time. Closely related peptide variants may have sufficiently similar chromatographic behaviour to merge into a single peak. A symmetrical main peak is reassuring only to the extent that the method has demonstrated suitable separation.
Detector choice introduces another boundary. UV detection is widely used because peptide bonds and some amino acids absorb ultraviolet light. Wavelengths around 214 nm or 220 nm are common in peptide analysis, but not every substance responds strongly at those wavelengths. Weakly absorbing components may produce small signals or escape useful detection.
Other analytical questions sit outside the usual scope of a routine peptide purity run:
- Residual solvents are commonly investigated using gas chromatography.
- Elemental or metal residues need suitable elemental analysis.
- Moisture and counter-ion content require appropriate separate measurements.
- Microbiological status and endotoxin require their own methods where relevant.
These are not failures of chromatography. They illustrate why a testing programme should be chosen around the material and research question, rather than expecting one trace to answer every quality-control question.
Investigating unusual peak shapes
Chromatograms contain more information than the number of visible peaks. Shoulders, tailing, fronting, split peaks and unstable baselines can all complicate interpretation. They may indicate insufficient separation, but can also arise from injection-solvent mismatch, column ageing, overloading or instrument conditions.
A broad or irregular peak is therefore a reason to examine the analysis, not immediate proof of a defective batch. Conversely, a tidy trace is not enough to establish the absence of closely related impurities. Interpretation requires knowledge of the method’s performance and the types of non-target material that could plausibly be present.
Retention-time changes need similar care. Under consistently applied conditions, a substantial shift may suggest a change in the sample or analytical system. Mobile-phase composition, column performance and instrument settings can all contribute. Comparing retention times from different methods without accounting for those differences can be misleading.
Why two laboratories may report different percentages
Chromatographic results depend on more than the sample. Column chemistry, gradient, mobile phases, temperature and detector settings affect which components separate and how strongly they appear. Two laboratories using different conditions may therefore obtain different area percentages without either result necessarily being invalid.
Integration adds another source of variation. Analysts must define peak boundaries, handle baseline drift and decide which small signals meet the criteria for inclusion. Different thresholds can alter the reported proportion attributed to the principal peak, particularly where minor signals sit close to it.
For meaningful comparisons, a report should identify the method and provide enough context to understand the calculation. Useful details include the detection wavelength, column chemistry, run conditions, sample concentration and reported retention time. The chromatogram should be linked to the correct batch and testing date.
Method validation provides further evidence about performance. Specificity, precision, linearity, accuracy and detection limits can be relevant, depending on the analytical purpose. A routine certificate may not reproduce the complete validation record, but it should not imply that every possible impurity has been excluded.
Using mass information to investigate peaks
Mass spectrometry complements chromatography by measuring mass-to-charge signals. Where HPLC shows a minor peak without identifying it, mass information can help investigate whether that signal is consistent with a related peptide or another component.
In LC-MS, chromatographic separation and mass analysis are combined. This can connect a retention-time region with observed mass signals and support assessment of both the principal component and secondary peaks. It is particularly useful when a purity trace raises a question that peak position alone cannot answer.
Mass spectrometry also has limitations. Ionisation behaviour, preparation, calibration and interpretation affect the result, and expected mass does not settle every structural ambiguity. The strongest conclusions come from complementary evidence, not from treating either technique as a complete substitute for the other.
Do not confuse impurity detection with peptide quantity
A sample can show a high main-peak area percentage while containing water, salts or counter-ions that contribute to its total mass. A routine purity chromatogram consequently does not establish how much peptide is present by weight.
Quantitative assays need appropriate calibration and reference standards. Depending on the objective, laboratories may use validated UV-based measurements, amino acid analysis or other approaches. The distinction matters because relative chromatographic composition and absolute peptide content answer different experimental questions.
Nor does an impurity profile establish future stability. The result relates to the tested sample and its condition at analysis. Subsequent handling and transport history remain relevant when interpreting whether the evidence represents the material used in an experiment.
A useful sequence for reviewing the evidence
First establish traceability: match the compound name, lot number, testing date and report to the material. Then inspect the trace for labelled peaks, retention times and sufficient clarity to assess the baseline and separation.
Next examine the calculation. Is the result explicitly an HPLC area percentage? Are detector conditions stated? Is there evidence that likely related impurities can be separated? If mass confirmation is provided, check that it relates to the same material rather than an unspecified reference sample.
Finally, identify what the experiment requires beyond routine impurity screening. A project sensitive to trace contaminants may need targeted analysis, while a batch-comparison exercise may depend especially on consistent methods. The required evidence follows from the research question.
For a compound-level example, consult the TZ research material profile. The Jakarta delivery information concerns shipments from Germany, the USA or China, with a delivery window of 5–18 business days from tracking, not local premises. Further ordering context is available in Regena’s research-supply overview.
HPLC is valuable because it makes many non-target components visible and supports documented comparison. Its limits are equally important: no visible impurity is not the same as no impurity present. These materials are for research use only and not for human consumption.
Peptides in this article
Add a solvent
- Bacteriostatic Water
Kit of 10 × 10 ml vials · Standard solvent for most peptides
€149.00 - Acetic Acid Kit
Kit of 10 × 3 ml vials (liquid) · For peptides that stay cloudy in BAC water
€149.00
Share Regena with a research colleague. They get trusted peptides; you earn 3–30% affiliate commission based on your monthly referred sales.
More research reading
Not sure which peptide fits your research question?
Take the 60-second Find Your Peptides quiz — it points you to the most relevant reference compounds for your area of investigation.
Start the quiz