
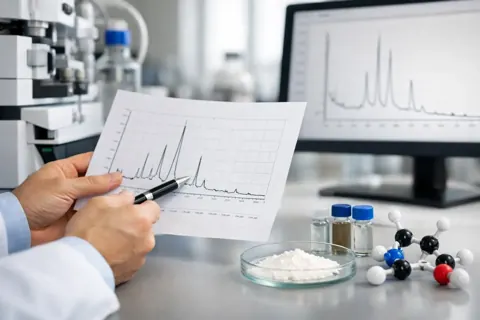
An HPLC report is most useful when its separate parts agree: the sample identifier matches the batch, the peak table matches the graph, and the stated result reflects the method used. A high percentage without those connections leaves important questions unanswered.
For research-use peptides, reviewing the document is therefore an exercise in traceability as much as chromatography. HPLC can describe relative chromatographic composition, but it does not independently establish identity, peptide content, sterility or suitability for a particular experiment. These materials are for research only, not human consumption.
Begin with the record, not the graph
First establish which sample the report describes. Look for the peptide name, batch or lot number, analysis date and a report or reference number where available. Compare these details with the relevant product label and certificate of analysis.
A report for a different batch may provide background information, but it is not evidence for the lot in hand. Likewise, an example report explains a testing approach without necessarily documenting the material being considered.
Check whether supporting pages belong together. A chromatogram, mass result and summary certificate are most informative when their identifiers clearly connect them to the same batch. Missing links should prompt a request for clarification rather than an assumption that the records correspond.
Separate the acceptance criterion from the finding
Specifications and results serve different purposes. A specification states the criterion set for the material; a result records what was measured in the tested sample.
For example, “not less than 98%” is an acceptance threshold. “98.6% by RP-HPLC” is a reported batch measurement. A document may legitimately contain both, but the threshold should not be mistaken for the observed value.
This distinction is particularly useful when certificates use brief entries such as “pass”. Such wording may record a decision against a specification, but it provides less analytical detail than the underlying numerical result. Ask for the measured value and relevant data when they are needed for research assessment.
Understand what the chromatogram records
High-performance liquid chromatography separates sample components as they pass through a column under controlled conditions. A detector follows the material emerging from the column and produces a chromatogram.
Time, usually in minutes, appears on the horizontal axis. The vertical axis gives detector response, commonly UV absorbance at a selected wavelength. Peaks mark detected material eluting during the run. The accompanying table may list retention times, areas, heights and area percentages.
The largest peak is generally assigned to the expected principal component, although that assignment needs supporting evidence. A peak can contain unresolved components, so its apparent prominence is not complete proof of composition or identity.
If the principal signal contributes 98.7% of the total integrated area, the report may describe the result as 98.7% HPLC purity. That is a chromatographic area measurement under specified conditions, not a statement that the same percentage of every vial's gross mass is peptide.
Reconcile the table with the trace
Find the principal peak in the graph and locate the corresponding retention time in the table. Then check its area percentage. These entries should describe the same signal without unexplained discrepancies.
Peak height is not interchangeable with area. A tall, narrow peak and a lower, broader peak can contribute differently to the integrated total. Purity calculations generally rely on the area beneath the signals rather than their maximum height.
A principal peak reported at 99.1% area represents 99.1% of the integrated detector response. The remaining 0.9% may be distributed across several minor peaks. The calculation depends on which signals were included and how their boundaries were assigned.
Inspect the graph for broadening, splitting, fronting or tailing. Such features can arise from sample loading, solvent conditions, column interactions or the sample itself. They require context rather than an automatic conclusion about material quality.
Evaluate minor signals without over-identifying them
Peptide reports may contain small peaks associated with deletion sequences, oxidation products, synthesis-related by-products, residual protecting-group material or degradation products. Analytical artefacts can also contribute signals.
Their total integrated contribution and separation from the main peak matter more than a simple count. Several well-resolved small peaks may be easier to assess than one shoulder partly hidden beneath the principal signal.
Earlier or later elution can reflect differences in polarity, while neighbouring peaks may involve structurally related components. These observations do not identify an impurity on their own. Any specific assignment requires additional evidence.
Baseline quality matters too. Noise, drift and unexplained disturbances can complicate integration, especially for low-level signals. Where integration markers or a full table are absent, request them before placing too much weight on a headline percentage.
Read the method as part of the result
The method determines which components can be separated and how they are detected. Useful report details include the column type, mobile phases, gradient programme, flow rate, detection wavelength, injection volume and run time.
Reverse-phase HPLC is commonly used for peptides because separation depends on hydrophobic interactions. Methods may use water and acetonitrile with an acidic modifier. UV monitoring at 214 nm or 220 nm is common because peptide bonds absorb strongly in this region.
Detection at 280 nm may be relevant for peptides containing aromatic residues, but the relative response can differ. A change in wavelength can therefore change how individual components contribute to the reported area percentage.
Column chemistry, gradient and integration settings also influence resolution and area. A result of 98% under one method and 99% under another is not necessarily contradictory. Before comparing values, establish whether the methods are sufficiently comparable.
Retention time follows the same rule. It supports consistency checks under matched conditions, but can shift with changes in column, temperature, solvent programme or flow. Different substances may also have similar retention behaviour, so time alone is not a unique identity test.
Distinguish area purity, content and identity
These three questions require different evidence:
- Area purity: how much of the integrated chromatographic response belongs to the principal peak?
- Peptide content: how much peptide material is present relative to the stated quantity or gross sample mass?
- Identity: does the analytical evidence support the expected compound?
Water, counterions, residual solvents and salt form can affect the relationship between gross mass and net peptide content. A high HPLC area percentage does not account for all of these factors.
Content assessment may require methods such as amino acid analysis, quantitative NMR, elemental analysis or a validated assay, depending on the analytical question. Mass spectrometry provides a different contribution by checking whether the observed molecular mass is consistent with the expected peptide.
No single method answers every quality question. Supporting mass data strengthen an identity assessment, but do not replace a separation measurement or establish net peptide content by themselves.
Recognise the boundaries of the report
UV detection does not respond equally to every substance. Weakly absorbing components may be under-represented, and co-eluting impurities may remain hidden beneath the main peak. A clean-looking trace reflects both sample composition and the resolving power of the method.
The report also describes the tested sample at the time of analysis. Moisture, temperature, repeated handling and time in solution can subsequently affect peptide material. The certificate is not an indefinite assurance of unchanged composition after storage or laboratory preparation.
Third-party testing can add useful evidence when the laboratory, method and batch linkage are documented. Its value lies in those details, not merely in a logo or the word “independent”. Where the evidence is incomplete, asking for the full report is more productive than ranking samples by percentage alone.
Put the documentation review before ordering
Use batch analytical reports to examine the available records and identify any missing batch references, method details or supporting data. Keep unresolved questions separate from confirmed findings in your own laboratory documentation.
The Oxytocin research material page provides compound-specific ordering context, including the presentation of sizes, 10-vial kits and report requests. Researchers using the Miami delivery information should note that parcels ship from Germany, the USA or China. Delivery typically takes 5–18 business days from tracking being issued; this is not a local-premises service.
Use a repeatable review sequence
For each report, confirm the batch, distinguish specification from result, reconcile the graph and table, and review the analytical conditions. Then consider identity data, content information where relevant and any limits affecting interpretation.
A useful report need not be elaborate. It needs to make clear what was tested, how it was measured and which conclusions the evidence supports. That approach keeps research decisions grounded in traceable data rather than the visual impact of a single peak.
Peptides in this article
Add a solvent
- Bacteriostatic Water
Kit of 10 × 10 ml vials · Standard solvent for most peptides
€149.00 - Acetic Acid Kit
Kit of 10 × 3 ml vials (liquid) · For peptides that stay cloudy in BAC water
€149.00
Share Regena with a research colleague. They get trusted peptides; you earn 3–30% affiliate commission based on your monthly referred sales.
More research reading
Not sure which peptide fits your research question?
Take the 60-second Find Your Peptides quiz — it points you to the most relevant reference compounds for your area of investigation.
Start the quiz